So you’ve already purchased your ERP Software and have started to shift all of your data into a document management system. As the data starts piling up, you’re left wondering how you are going to make sense of the massive volumes of information. This is where the Business Analytics tools of your software solution come into play.
What is Business Analytics?
Business Analytics is the process of analyzing all of your past and current data sets and converting them into easy to read formats in order to make informed business decisions. With the vast volume of information that construction companies have coming in constantly, business analytics tools have become an important tool for their success. Modern analytics software is able to process this information in real time, allowing construction companies to measure their key performance indicators (KPIs) quickly to improve project delivery.

What is the Process?
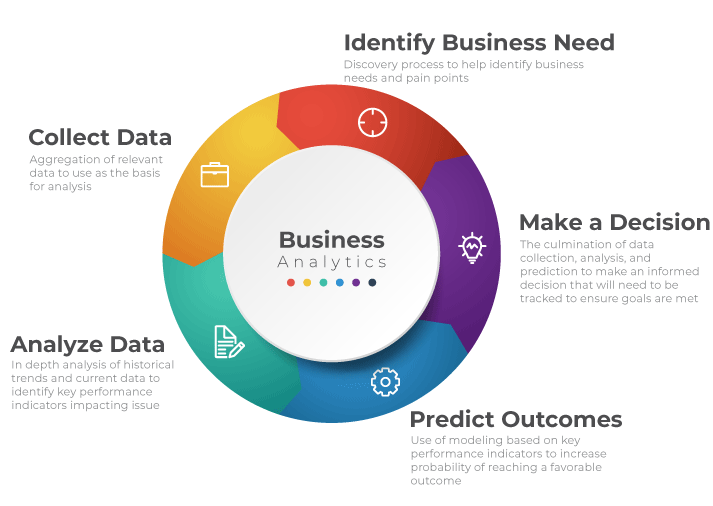
Making business improvements is a constant process of analyzing data to make predictions for the best course of action. There are many ways to break down the process, but each method tends to have similar core steps. We like to break the process down into these points; Identify Business Need, Collect Data, Analyze Data, Predict Outcomes, and Make a Decision.
Identify Business Need
The first step is to properly identify what your business needs in order to improve. This discovery process typically begins with open-ended questions with people involved in the process to help discover any underlying issues your company may be having and their potential causes. You can start to gather some information to figure out any pain points.
Collect Data
After identifying your business need, you’ll have to gather data before you can make any form of analysis. Depending on your identified need, you’ll collect the relevant data that will be useful. For example, if you are having an issue with the accuracy of your bids, collecting data on job costs, change orders, materials, equipment usage, and labor hours will be needed for proper analysis. Having a central document repository in your ERP speeds up this process as you are able to access all of your company’s information from multiple departments with ease.
Analyze Data
Analysis can begin after aggregating all of your relevant data. You’ll first want to create a big picture look at your historical data in order to identify trends leading up to the current issue. You can then drill down into the current elements that are impacting your business. Once you discover which data points are at the root KPIs of the issue, you can start to reach an understanding at what needs to be changed in order to resolve your issue.
Predict Outcomes
With the KPIs identified, you can then forecast and model what changes you need to make in order to obtain a favorable result. By testing multiple models, you can start to predict which choice will increase the probability of your target goal. This will help guide which decision your company will make.
Make a Decision
So you’ve identified an issue, collected and analyzed the data, and ran predictive models. Now what? You have to make a decision with the insights you have gleaned from the modeling and data analysis. Based on everything you had to do to get to this point, it’s important to then monitor your choice and reflect on it once enough time has passed.
Creating a customized dashboard is the easiest way to keep an eye on the performance of the decision. If you are using a fully integrated ERP solution, you can also set up alerts to notify you immediately with changes to your KPIs so you can stay on top of the issue.
